4.2 Debugging a Running Kernel Using RealView Debugger
This section assumes that you are attaching an RVD session to a running kernel. Using
RVD to boot a kernel on a target board is covered in Section 4.3.
4.2.1 Set up the Debug Connection
1 Start RVD.
2 Create a debug connection to the target hardware as normal
(Target -> Connect to target...). See the RealView Debugger User
Guide for more information about creating debug connections in RVD.
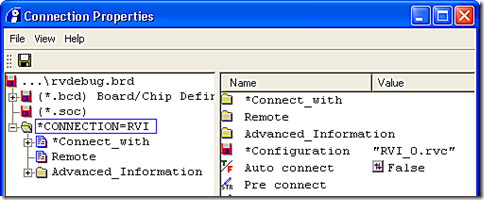
3 Open up the debug connection, right-click on the core that you will attach the
debugger to and select Properties from the context menu to open the
Connection Properties dialog.
4 Open up the selected connection in the tree view (left-hand pane) of the
Connection Properties dialog.
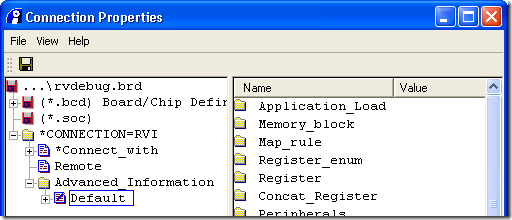
5 Still in the tree view, open up Advanced Information and select Default.
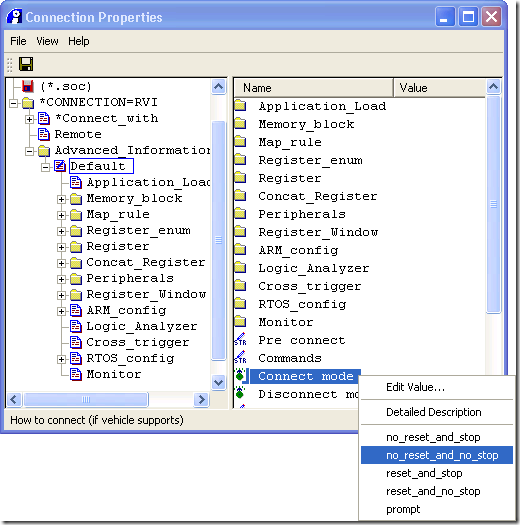
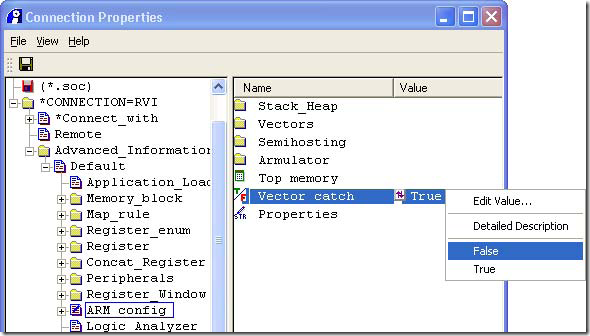
7 In the tree view, open up Default and select ARM_config.
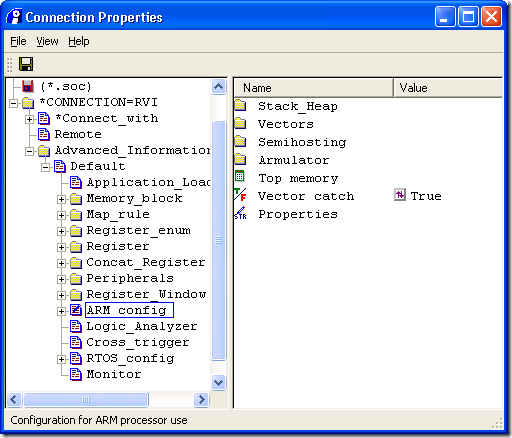
8 In the right-hand pane, set Vector catch to False. This will prevent RVD from
intercepting exceptions. Exceptions can occur in the normal operation of the
kernel and will be handled by it.
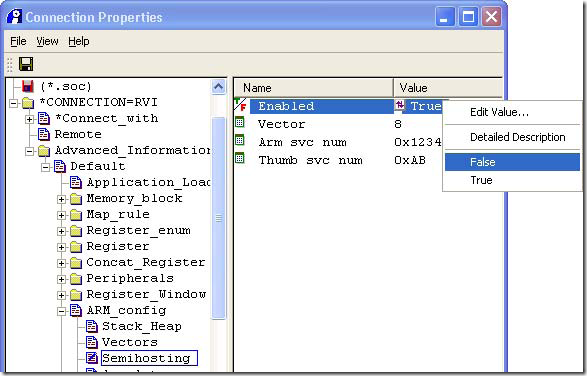
9 In the tree view, open up ARM_config and select Semihosting.
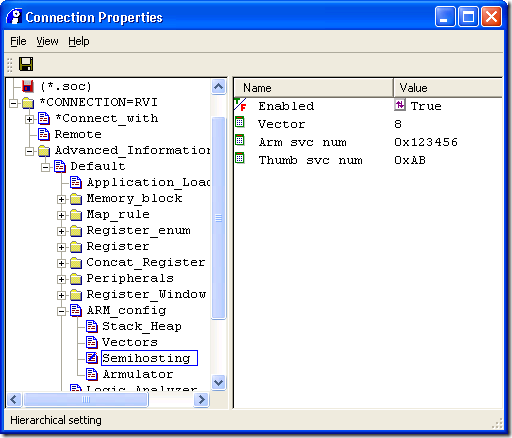
10 In the right-hand pane, set Enabled to False. The Linux C runtime does not use
semihosting and so RVD should not be attempting to provide semihosting services.
11 Save the changed connection properties and close the dialog.
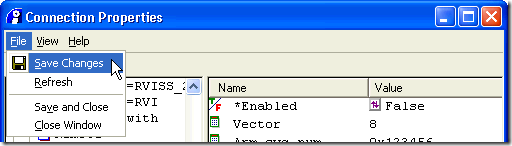
12 The debug connection can now be used to connect to the target.
Note If you have set a Board/Chip definition file for this connection, then this file might contain
values for this connection that override the target connection settings that you have made
in this section.
4.2.2 Load Debug Symbols
1 If you have not done so already, connect to the target.
2 Open the Load Image dialog by selecting Load Image... from the Target
menu.
In the Files of Type drop-down, select All files (*).
Tick the Symbols Only check box. It is the responsibility of your boot loader to
load the kernel code: you do not want RVD to load it again.
Ensure that Auto-Set PC and Set PC to Entry Point are not ticked. Your
system is already running, so you do not want RVD to change the PC.
Navigate to the location of your kernel source tree and select the vmlinux file
that is at its root. This file contains the kernel’s debug information.
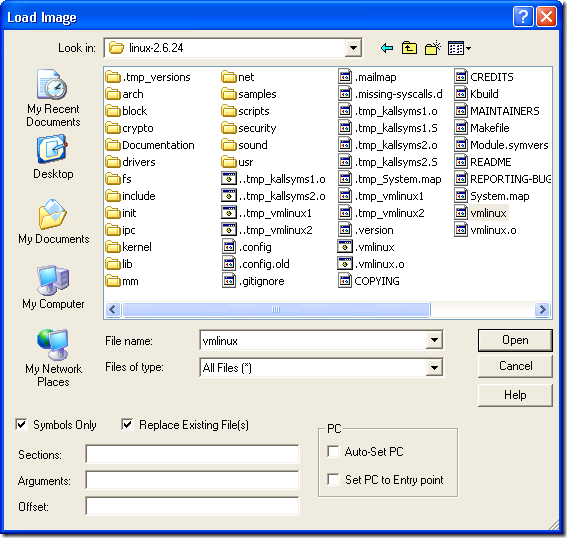
3 Press the Open button. RVD will load the debug symbols for the Linux kernel.
This may take some time.
4 RVD now has the kernel debug information loaded and is able to proceed with
debugging in the usual manner
4.2.3 Debug the Kernel
You can debug the kernel as you would any other software running on the target.
However, there are some issues to be aware of when using RealView Debugger to debug
the Linux kernel.
1 Only statically compiled kernel code can be debugged with RVD, not Linux
applications and not loadable kernel modules (see the FAQ Can I debug Linux
applications and Kernel modules using RVD? athttp://infocenter.arm.com/help/index.jsp?topic=/com.arm.doc.faqs/14250.html).
2 Software breakpoints can be set at any point after the MMU has been initialized,
which means at any point from MAIN\start_kernel onwards. The RealView
Debugger User Guide has full information about setting breakpoints with RVD,
but as an example, typing the following in the Cmd window will set a breakpoint at
the beginning of MAIN\start_kernel:
binstr &@vmlinux\\MAIN\start_kernel
There are no restrictions on when hardware breakpoints (set with the bexec
instruction) may be set.
3 RVD does not provide any special awareness of the Linux kernel and will treat it
as it would any other software running directly on the hardware target. It is
therefore not possible to tell, for example, which process was running when a
kernel breakpoint is triggered, or even if two consecutive breakpoint hits were
caused by the same process.
4 Unless you are able to configure your kernel to build with no optimizations and
full debug information, you will not get a perfect debug illusion. For example, the
debugger may appear to skip source lines, or to be executing a different source
line from the one that is actually currently being executed. Note that the ARM
Embedded Linux kernel build does not permit all optimizations to be disabled.
Although the General setup submenu of the kernel configuration has an
Optimize for size option, disabling this option causes the build to
optimize for performance instead of code size, so the kernel will still contain
optimized code
This section assumes that you are attaching an RVD session to a running kernel. Using
RVD to boot a kernel on a target board is covered in Section 4.3.
4.2.1 Set up the Debug Connection
1 Start RVD.
2 Create a debug connection to the target hardware as normal
(Target -> Connect to target...). See the RealView Debugger User
Guide for more information about creating debug connections in RVD.
3 Open up the debug connection, right-click on the core that you will attach the
debugger to and select Properties from the context menu to open the
Connection Properties dialog.
4 Open up the selected connection in the tree view (left-hand pane) of the
Connection Properties dialog.
5 Still in the tree view, open up Advanced Information and select Default.
7 In the tree view, open up Default and select ARM_config.
8 In the right-hand pane, set Vector catch to False. This will prevent RVD from
intercepting exceptions. Exceptions can occur in the normal operation of the
kernel and will be handled by it.
9 In the tree view, open up ARM_config and select Semihosting.
10 In the right-hand pane, set Enabled to False. The Linux C runtime does not use
semihosting and so RVD should not be attempting to provide semihosting services.
11 Save the changed connection properties and close the dialog.
12 The debug connection can now be used to connect to the target.
Note If you have set a Board/Chip definition file for this connection, then this file might contain
values for this connection that override the target connection settings that you have made
in this section.
4.2.2 Load Debug Symbols
1 If you have not done so already, connect to the target.
2 Open the Load Image dialog by selecting Load Image... from the Target
menu.
In the Files of Type drop-down, select All files (*).
Tick the Symbols Only check box. It is the responsibility of your boot loader to
load the kernel code: you do not want RVD to load it again.
Ensure that Auto-Set PC and Set PC to Entry Point are not ticked. Your
system is already running, so you do not want RVD to change the PC.
Navigate to the location of your kernel source tree and select the vmlinux file
that is at its root. This file contains the kernel’s debug information.
3 Press the Open button. RVD will load the debug symbols for the Linux kernel.
This may take some time.
4 RVD now has the kernel debug information loaded and is able to proceed with
debugging in the usual manner
4.2.3 Debug the Kernel
You can debug the kernel as you would any other software running on the target.
However, there are some issues to be aware of when using RealView Debugger to debug
the Linux kernel.
1 Only statically compiled kernel code can be debugged with RVD, not Linux
applications and not loadable kernel modules (see the FAQ Can I debug Linux
applications and Kernel modules using RVD? athttp://infocenter.arm.com/help/index.jsp?topic=/com.arm.doc.faqs/14250.html).
2 Software breakpoints can be set at any point after the MMU has been initialized,
which means at any point from MAIN\start_kernel onwards. The RealView
Debugger User Guide has full information about setting breakpoints with RVD,
but as an example, typing the following in the Cmd window will set a breakpoint at
the beginning of MAIN\start_kernel:
binstr &@vmlinux\\MAIN\start_kernel
There are no restrictions on when hardware breakpoints (set with the bexec
instruction) may be set.
3 RVD does not provide any special awareness of the Linux kernel and will treat it
as it would any other software running directly on the hardware target. It is
therefore not possible to tell, for example, which process was running when a
kernel breakpoint is triggered, or even if two consecutive breakpoint hits were
caused by the same process.
4 Unless you are able to configure your kernel to build with no optimizations and
full debug information, you will not get a perfect debug illusion. For example, the
debugger may appear to skip source lines, or to be executing a different source
line from the one that is actually currently being executed. Note that the ARM
Embedded Linux kernel build does not permit all optimizations to be disabled.
Although the General setup submenu of the kernel configuration has an
Optimize for size option, disabling this option causes the build to
optimize for performance instead of code size, so the kernel will still contain
optimized code
No comments:
Post a Comment